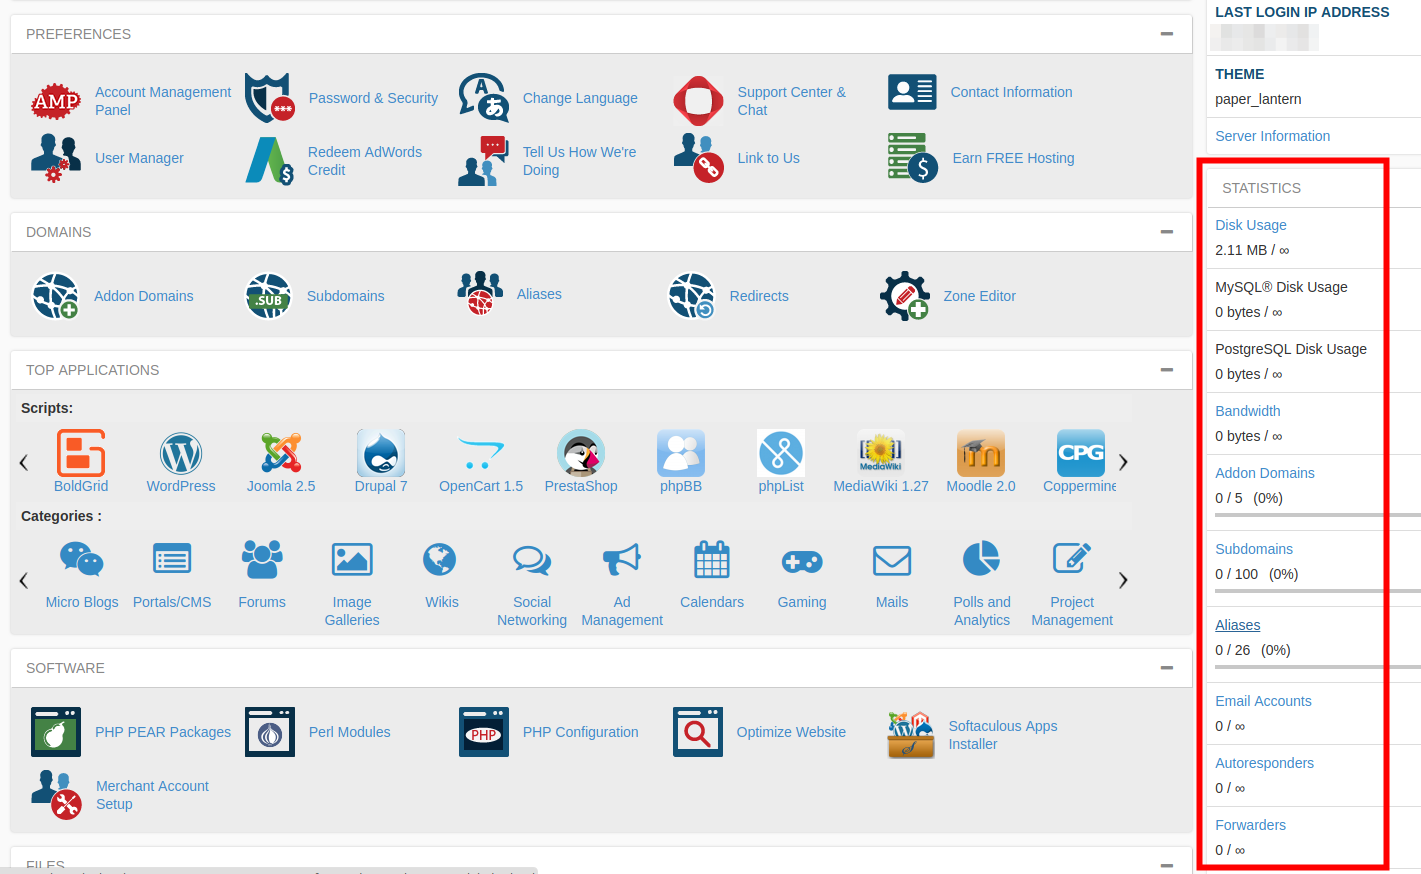
Yes, that’s correct! cPanel provides various statistics related to your account on its main page for your convenience. These statistics include information about your CPU and memory usage, MySQL databases, email forwarders, and more. Here are the steps to view your cPanel statistics:
- Log in to your cPanel account.
- Once you are logged in, you will see the statistics section on the right-hand side of the main page. This section displays various statistics about your account.
- To view more detailed information about a particular statistic, simply click on the corresponding link. For example, to view more information about your CPU and memory usage, click on the “CPU and Concurrent Connection Usage” link.
- You can also access more detailed statistics by clicking on the “View More” link located at the bottom of each section.
That’s it! Now you know how to view your cPanel statistics directly from the main page.
View cPanel Statistics
- Log into cPanel.
- You will see your cPanel Statistics over to the right.

Below is a description of the available information.
| Statistic | Description |
|---|---|
| Disk Usage | Shows how much disk space you are taking up in MB. |
| MySQL® Disk Usage | Shows how much disk space your MySQL® databases are using. |
| PostgreSQL Disk Usage | Shows how much disk space your PostgreSQL databases are using. |
| Bandwidth | Shows how much bandwidth your account has consumed this month. |
| Addon Domains | See how many Addon domains you have set up. |
| Subdomains | See how many Subdomains your account is using. |
| Aliases | View how many Aliases (formerly called Parked domains) you have set up. |
| Email Accounts | View how many email accounts you have created. |
| Autoresponders | See how many email autoresponders you have set up. |
| Forwarders | See how many email forwarders you have set up. |
| Email Filters | View the number of email filters you have set up. |
| FTP Accounts | See how many FTP accounts you have created. |
| MySQL® Databases | View the amount of MySQL® databases you have created. |
| PostgreSQL Databases | View the amount of PostgreSQL databases you have created. |
| CPU Usage | View the amount of CPU your account is using. |
| Entry Processes | See the amount of PHP scripts that are currently running. |
| Physical Memory Usage | View the amount of physical memory you are using. |
| IOPS | View the size of input-output operations your account is using per second. |
| I/O Usage | View the amount of input and output your account has used. |
| Number of Processes | See the number of processes your account is currently running |
Congratulations, now you know how to view cPanel statistics!
Did you know? Not all hosting companies provide free access to cPanel. InMotion does and it’s just one of the many features of our various web hosting plans.
